
Bitcoin is holding firm around the $70,000 level after one of its sharpest sell-offs this cycle, leaving investors split on what comes next.
On-chain data, ETF flows, and market structure signals now point in two opposing directions, raising a key question: is Bitcoin preparing for another leg up, or setting up for renewed downside?
Sponsored
Sponsored
Selling Pressure Remains Elevated
One of the clearest warning signals comes from Bitcoin’s growth rate difference between market cap and realized cap. The indicator remains in negative territory, historically associated with heavier selling pressure.
When realized cap grows faster than market cap, it suggests coins are being redistributed at lower prices rather than pushed higher by fresh demand.
In past cycles, this environment made sustained price “pumps” difficult, as rallies were often met with distribution rather than follow-through.
Overall, current conditions suggest a structural selling pressure overwhelming demand.
Whales are Buying Bitcoin Aggressively
At the same time, on-chain accumulation data tells a very different story. Inflows to long-term accumulation addresses surged sharply during the recent dip, marking the largest single-day inflow of this cycle.
Sponsored
Sponsored
Historically, such spikes tend to appear near local bottoms rather than tops.
While accumulation does not guarantee an immediate rally, it signals that large holders are absorbing supply instead of distributing it.
This creates a floor effect, limiting downside even when broader sentiment remains fragile.
Sponsored
Sponsored
Price Holds Above Realized Value
Bitcoin is also trading well above its realized price, which currently sits near the mid-$50,000 range. That keeps the broader network in profit and reduces the risk of widespread capitulation.
Previous cycles show that deep, sustained bear markets typically occur only when price falls below realized levels for extended periods.
For now, Bitcoin remains in a neutral-to-positive regime.
Sponsored
Sponsored
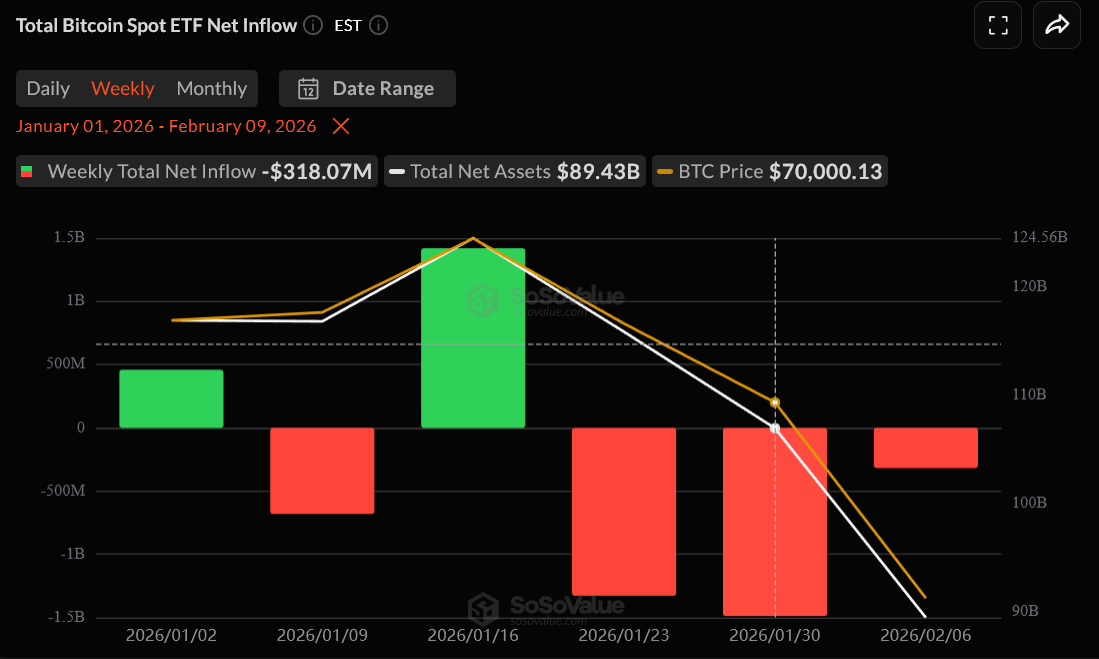
ETF Flows Stabilize After Shock Outflows
US spot Bitcoin ETFs recorded heavy outflows during the crash, validating Arthur Hayes’ view that institutional hedging and dealer mechanics amplified the move. However, flows flipped back to strong inflows once prices stabilized near $60,000–$65,000.
That reversal suggests the worst forced selling has passed, though ETF demand has not yet returned to levels that would drive a breakout.
Range-Bound, Not Explosive
Taken together, the data points to a market caught between accumulation and distribution. Whale buying and ETF stabilization support the downside, while persistent sell pressure limits upside momentum.
In the near term, Bitcoin is more likely to remain range-bound around $70,000 than enter a decisive pump or dump.